 ITS_LIVE
A NASA MEaSUREs project to provide automated, low latency, global glacier flow and elevation change datasets.
A NASA MEaSUREs project to provide automated, low latency, global glacier flow and elevation change datasets.

Satellite observations reveal how the world’s glaciers have responded to recent changes in climate, and can inform predictions of future sea level rise. To enable the next generation of ice sheet models and process-based studies, ITS_LIVE provides a decades-long, high-resolution record of global ice velocity and elevation change. The cloud-based ITS_LIVE architecture continually processes and synthesizes new data from multiple optical, radar, and laser satellite sensors, resulting in a high-resolution, low-latency product that can be used for scientific studies within days of data collection.
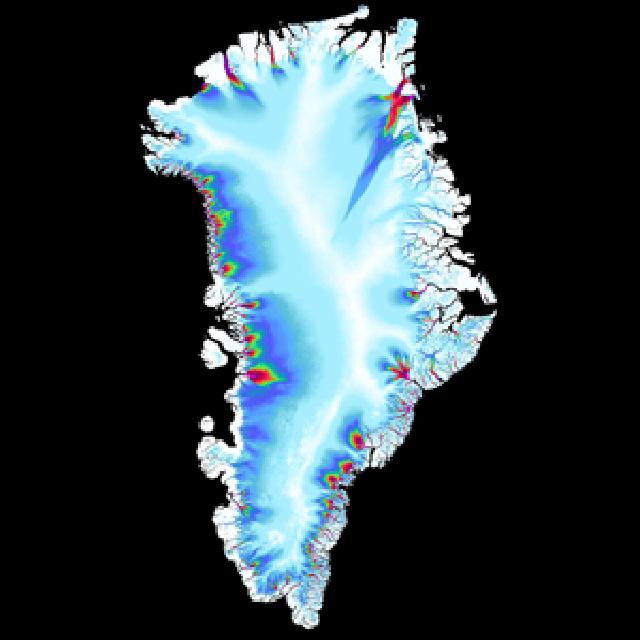
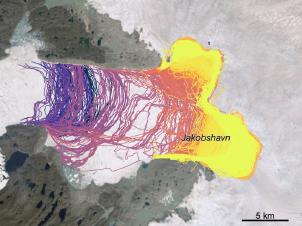
Regional velocity mosaics created from the synthesis of all scene-pair velocities.
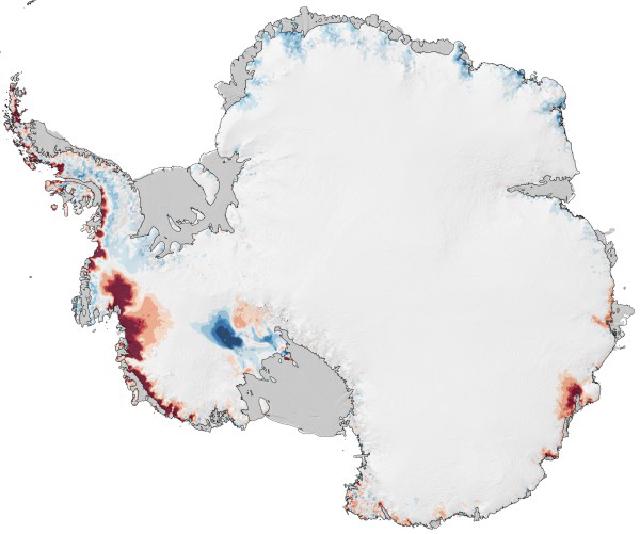
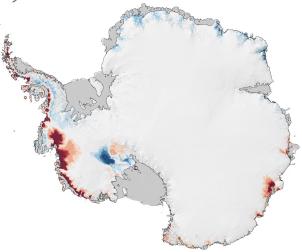
Elevation change from multi altimetry mission synthesis.
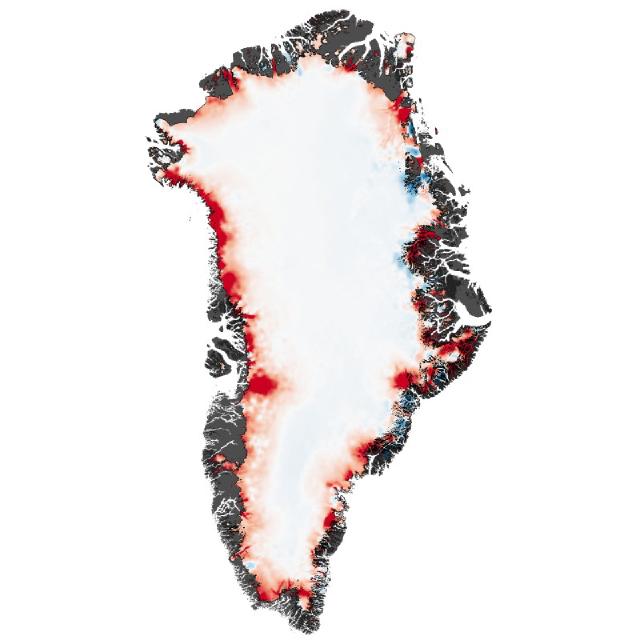
Elevation change of the Greenland Ice Sheet and its peripheral glaciers: (1992–2023)

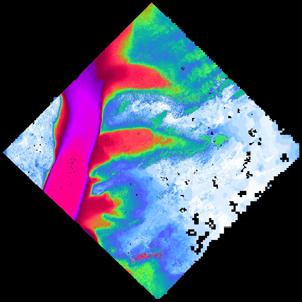
Scene-pair velocities generated from satellite optical and radar imagery.
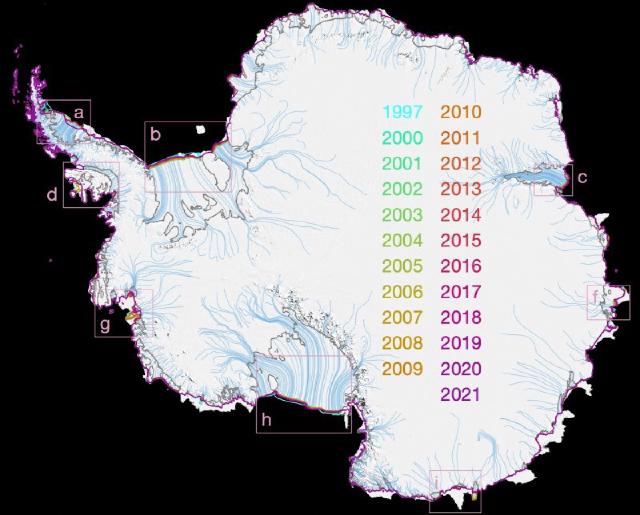
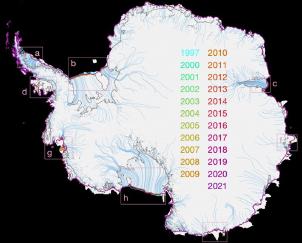
MEaSUREs ITS_LIVE Antarctic Annual 240 m Ice Sheet Extent Masks, 1997-2021, Version 1
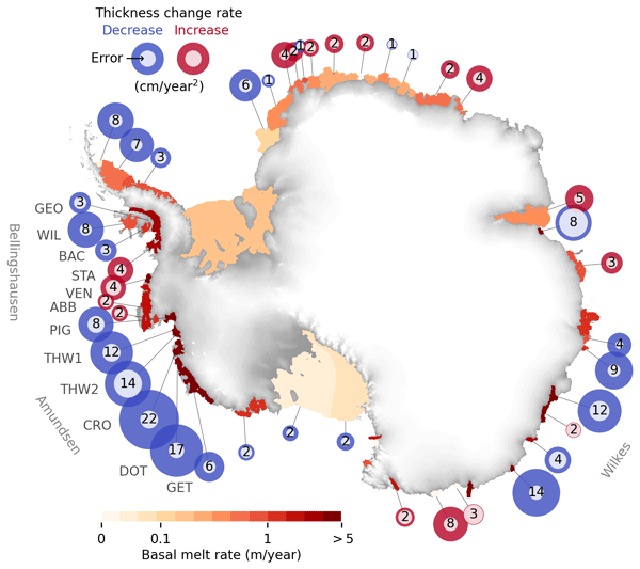
MEaSUREs ITS_LIVE Antarctic Quarterly 1920 m Ice Shelf Height Change and Basal Melt Rates, 1992-2017, Version 1

MEaSUREs ITS_LIVE Greenland Monthly 120 m Ice Sheet Extent Masks, 1972-2022, Version 1
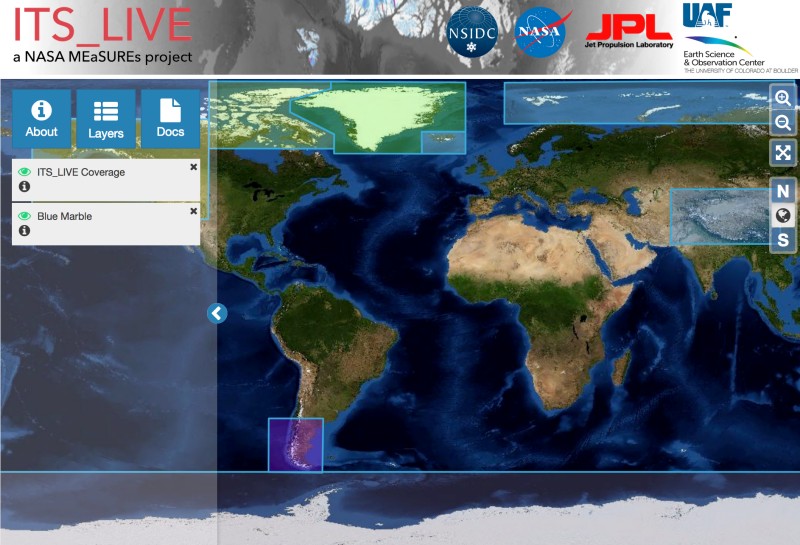
Web app to explore and download annual velocity mosaics and image pair data:
ITS_LIVE data is now accessible through a STAC API at https://stac.itslive.cloud. The API supports two collections:
The API supports spatial, temporal, and property-based filtering.
The recommended way to access the STAC API is using the pystac-client library:
from pystac_client import Client

# Connect to the ITS_LIVE STAC API
catalog = Client.open("https://stac.itslive.cloud")

# Search for image pairs over a region and time range
# Example: Iceland, 2015-2020
search = catalog.search(
    collections=["itslive-granules"],
    bbox=[-24.60, 63.78, -15.11, 66.30],  # west, south, east, north
    datetime=["2015-01-01", "2020-12-31"],
    max_items=10
)

# Iterate through results
for item in search.items():
    print(f"ID: {item.id}")
    print(f"Date: {item.properties['datetime']}")
    print(f"Data URL (HTTPS): {item.assets['data'].href}")
    # Access S3 URL directly for cloud workflows
    s3_url = item.assets['data'].extra_fields['alternate']['s3']['href']
    print(f"S3 URL: {s3_url}")
The API supports CQL2 (Common Query Language) filters for more complex queries:
from pystac_client import Client

catalog = Client.open("https://stac.itslive.cloud")

# Search with property filters
search = catalog.search(
    collections=["itslive-granules"],
    bbox=[-24.60, 63.78, -15.11, 66.30],
    datetime=["2015-01-01", "2020-12-31"],
    query={"sat:platform": {"eq": "LANDSAT-8"}}  # Filter by satellite
)

for item in search.items():
    # Access the NetCDF file
    data_url = item.assets['data'].href
    # Download or process the data...
from pystac_client import Client
import xarray as xr

catalog = Client.open("https://stac.itslive.cloud")

# Search for data cubes
search = catalog.search(
    collections=["itslive-cubes"],
    bbox=[-24.60, 63.78, -15.11, 66.30],
)

item = next(search.items())
# Open Zarr cube directly with xarray
ds = xr.open_zarr(item.assets['zarr'].href)
print(ds)
Note: For V1 data hosted at NSIDC (before April 2023), access requires authentication with NASA Earthdata Login (EDL). See:
- NSIDC Programmatic Access Guide
- earthaccess library for EDL authentication in Python
Jupyter notebooks to access and visualize ice velocity time series from ITS_LIVE data cubes.
Repository: https://github.com/nasa-jpl/its_live
Click the binder link below to browse the data now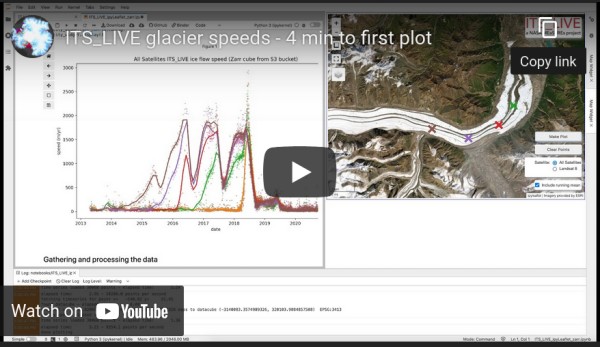
GeoJSON Data Cubes Catalog (5MB)
In addition to NetCDF image pairs and mosaics, ITS_LIVE produces cloud-optimized Zarr datacubes, which contain all image-pair data, co-aligned on a common grid for simplified data access. Cloud optimization enables rapid analysis without intermediary data servers, and ITS_LIVE datacubes map directly into Python xarray or Julia ZArray structures. ITS_LIVE provides basic access and plotting tools in both Python and Julia, making it easy to incorporate the datacubes into workflows locally or on remote servers.
Regional Glacier and Ice Sheet Surface Velocities - Version 1 (PDF - 0.3MB)
Landsat Image-Pair Glacier and Ice Sheet Surface Velocities: Version 1 (PDF - 2MB)
Regional Glacier and Ice Sheet Surface Velocities - known issues (PDF - 2MB)
Have any questions? Ask the ITS_LIVE community on GITTER
Working with ITS_LIVE data and basemaps in QGIS without downloading the data (PDF - 26MB)
autoRIFT: A highly accurate and efficient algorithm for finding the pixel displacement between two radar or optical images
NSIDC notebook: A Jupyter notebook to search and download ITS_LIVE scene-pair velocity.
Chad Greene's Matlab collection: A set of Matlab functions for accessing, analyzing, and plotting ITS_LIVE velocity data. These functions are intended to streamline the process of loading ITS_LIVE mosaics, interpolating, generating flowlines, and creating maps of ice flow.
ITS_LIVE API: An API for searching ITS_LIVE scene-pair velocities.
Geogrid: A Python module for precise mapping between (pixel index, pixel displacement) in imaging coordinates and (geolocation, motion velocity) in geographic Cartesian (northing/easting) coordinates
Emma Marshall's ITS_LIVE tutorial: A Jupyterbook tutorial to demonstrate how to access and work with with multi-dimensional remote sensing data from ITS_LIVE using xarray.
Jacob Fahnestock's velocity webapp: A serverless React-Leaflet website to plot and share ITS_LIVE data
The recommended citation for the Regional Glacier and Ice Sheet Surface Velocities is:
"Velocity data generated using auto-RIFT (Gardner et al., 2018) and provided by the NASA MEaSUREs ITS_LIVE project (Gardner et al., 20XX)."
The recommended citation for the Antarctic Ice Sheet Elevation Change data is:
"Antarctic Ice Sheet Elevation Change data (Nilsson et al., 2022) provided by the NASA MEaSUREs ITS_LIVE project (Nilsson et al., 20XX)."
Gardner, A. S., M. A. Fahnestock, and T. A. Scambos, 2019 [update to time of data download]: MEaSUREs ITS_LIVE Landsat Image-Pair Glacier and Ice Sheet Surface Velocities: Version 1. Data archived at National Snow and Ice Data Center. https://doi.org/10.5067/IMR9D3PEI28U
Gardner, A. S., M. A. Fahnestock, and T. A. Scambos, 2019 [update to time of data download]: ITS_LIVE Regional Glacier and Ice Sheet Surface Velocities: Version 1. Data archived at National Snow and Ice Data Center; https://doi:10.5067/6II6VW8LLWJ7.
Gardner, A. S., G. Moholdt, T. Scambos, M. Fahnstock, S. Ligtenberg, M. van den Broeke, and J. Nilsson, 2018: Increased West Antarctic and unchanged East Antarctic ice discharge over the last 7 years, Cryosphere, 12(2): 521–547, https://doi:10.5194/tc-12-521-2018.
Nilsson, J., Gardner, A., & Paolo, F. [update to time of data download]: MEaSUREs ITS_LIVE Antarctic Grounded Ice Sheet Elevation Change, Version 1, https://doi.org/10.5067/L3LSVDZS15ZV.
Nilsson, J., Gardner, A. S., and Paolo, F. S.: Elevation change of the Antarctic Ice Sheet: 1985 to 2020, Earth Syst. Sci. Data, 14, 3573–3598, https://doi.org/10.5194/essd-14-3573-2022, 2022.
Landsat 4,5,7,8 data were provided by the U.S. Geological Survey.
Copernicus Sentinel-1 and Sentinel-2 data were acquired, processed, and generated by the European Space Agency (ESA).
ERS-1 and ERS-2 altimetry data were provided by ESA’s Reprocessed ESA ERS Altimetry (REAPER) project.
Envisat and CryoSat altimetry data were acquired, processed, and generated by the European Space Agency (ESA).
ICESat & ICESat-2 altimetry data was provided by NASA through NSIDC.
All questions can be addressed to NSIDC User Services: nsidc@nsidc.org
 Alex Gardner
JPL, Caltech
Alex Gardner
JPL, Caltech Mark Fahnestock
 Ted Scambos
 Chad Greene
 Joe Kennedy
 Maria Liukis
 Luis López
 Johan Nilsson
 Alex Goodman
 Yang Lei
 Piyush Agram
 Daniel Cheng
 Anshul Singhvi
 Andrew Player
 Amaury Dehecq
 Fernando Paolo
 Catherine Walker
 Franz Meyer
 Noel Gourmelen
 Hamish Pritchard